Figures, Graphs, and Maps of the Casualties Incurred
Since the "End of Major Combat Operations"
May 1, 2003 - April 30, 2004
Casualty
Count:
Killed - 596
(4.26/1,000
troops)
(based on a rough
figure
of 140,000 troops total)
426 from hostilities
(71.5%)
Death Rates in
Perspective:
American Civil War -
164/1,000 troops
World War II -
66/1,000
troops
Korea - 77/1,000
troops
Operation Desert
Storm
- .66/1,000 troops
(based
on all troops serving)
And for the statistically-challenged Brit Hume:
"...statistically speaking U.S. soldiers have less of a chance of dying from all causes in Iraq than citizens have of being murdered in California, which is roughly the same geographical size."
Brit Hume, August 26, 2003 Fox News
California - 2,400 homicides among 34,500,000 people = .069 deaths/1,000
In other words, a soldier in Iraq was 61 times more likely to be killed
than the average Californian is of being murdered!
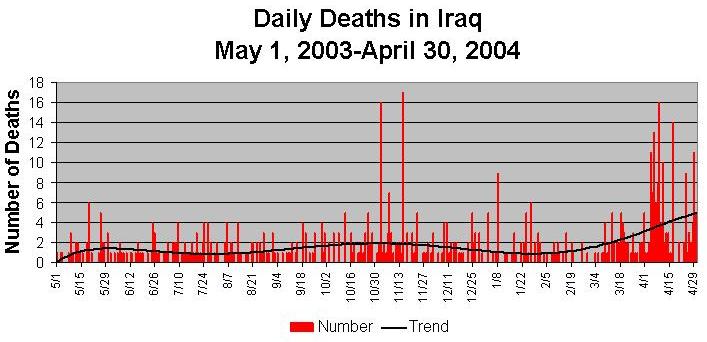
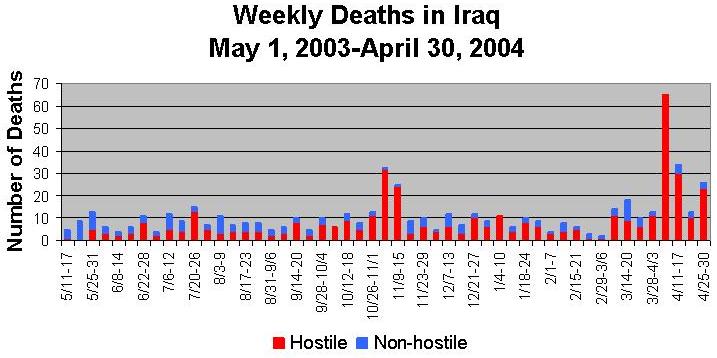

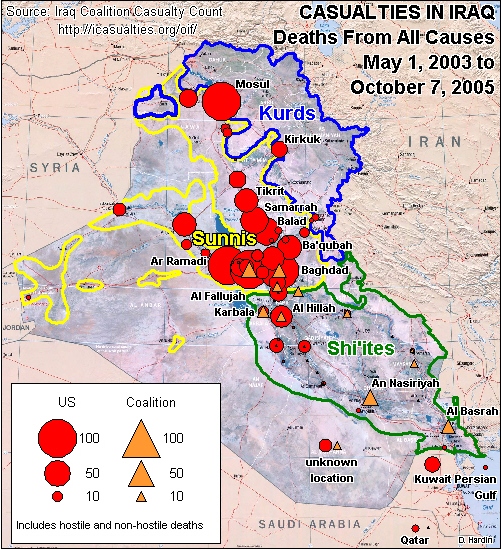
Figure for all
casualties,
as of 4/29/2004 4:00pm EST
Sources:
CENTCOM press
releases
(http://www.centcom.mil/CENTCOMNews/casualties.asp)
Department of Defense
press releases (http://www.defenselink.mil/releases/)
Iraq Coalition
Casualty
Count (http://lunaville.org/warcasualties/Summary.aspx)
Faces of Valor (http://www.militarycity.com/valor/honor2.html)
Created May 22, 2004